- Share The Comprehensive Guide to Content Marketing Analytics and Metrics on Facebook
- Share The Comprehensive Guide to Content Marketing Analytics and Metrics on Twitter
- Share The Comprehensive Guide to Content Marketing Analytics and Metrics on Linkedin
- Share The Comprehensive Guide to Content Marketing Analytics and Metrics via email
The single most perplexing question for anyone in content marketing is: How do I measure the effectiveness of my content marketing? More often than not when asked this question, marketers fall back on soft content marketing metrics like “page views” and “shares,” or anecdotes about how their content is working by way of feedback from the sales team.
There is a better way.
Content marketing has come a long way in the past few years. There are now definite content marketing metrics to answer this question, along with technologies that help quantify the return on your content marketing investment.
 The following guide provides a comprehensive overview of marketing metrics and analytics to help you determine the effectiveness of your content, and ultimately how it affects revenue. I also asked over 20 experts how they measure content marketing efforts.
We’ve included their answers throughout the post. For an even more in-depth analysis, check out the entire eBook I authored on this topic: The Comprehensive Guide to Content Marketing Metrics & Analytics.
Content Marketing Metrics: A Framework
Looking at metrics as a whole can be an intimidating task. To make it easier to identify the content marketing metrics most relevant to your business, it helps to break them down into distinct categories.
 REBECCA LIEB
Digital Advertising, Media & Content Analyst, Altimeter @lieblink
“It makes no difference whatsoever what MY most important content marketing metric is—the real question is: what metric, what key performance indicator is most important to your business? No two marketers’ objectives are exactly alike. What matters is aligning against business goals, not all the abstract things you can measure.”
To start off, I have adapted a four part framework proposed by Jay Baer in his eBook on this topic, and placed this into an inverted pyramid model as shown below:
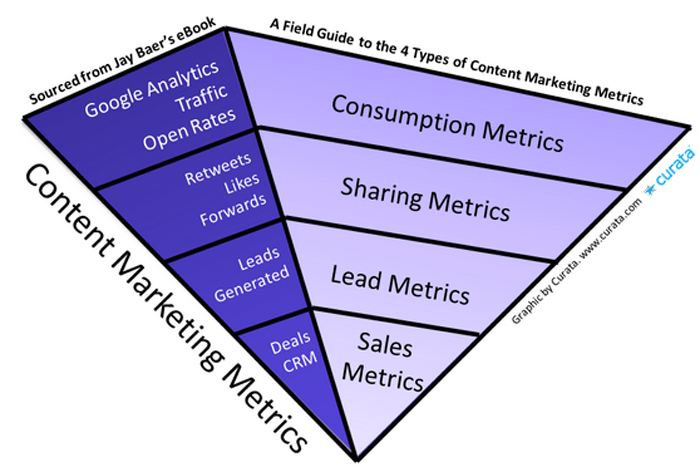
If you look at the various content marketing metrics, you can answer many of your most pressing content marketing strategy questions:
- Consumption Metrics:
- How many people are consuming your content?
- Which channels are they using?
- How frequently and how in-depth is their consumption?
- Sharing Metrics:
- Which of your content pieces are being shared?
- Who is sharing them?
- How/where are they sharing?
- How often are they being shared?
- Lead Metrics:
- How is content supporting demand generation in terms of lead generation and lead nurturing (middle-of-the-funnel)?
- Sales Metrics:
- How does your content influence bottom-of-the-funnel results?
- Which ways does your content drive revenue?
- How does your content fill the pipeline?
Four Additional Metrics
In addition to Jay’s four categories, we have identified four additional types of marketing metrics (two customer-focused and two production-focused). These provide more detail and clarity about the ROI of content marketing:
- Retention (Subscription) Metrics:
- How effective are you at holding your audience’s attention beyond the initial point of contact?
- Engagement Metrics:
- How does the intersection of consumption and sharing metrics translate into “engagement?”
- Does your content inspire users to take some kind of action?
- What kind of action are they taking?
- How frequently and consistently are they taking action?
- Production Metrics: (to assess team and/or individual performance)
- How is your team performing against editorial calendar deadlines and goals?
- What time does it take your team to turn a content idea into a published piece of content?
- How many pieces of content do you regularly publish in a given period of time?
- Cost Metrics: (to determine return on investment – ROI)
- What are your overall content marketing costs?
- What are your costs per piece? Per creative resource?
You can measure each of the above marketing metrics across several content channels, such as websites, blogs, or social media. The following framework maps the content marketing metrics (in the order they appear in the marketing and sales funnel) against content channels. Using this framework, you can get a better idea of how to measure content across all channels.
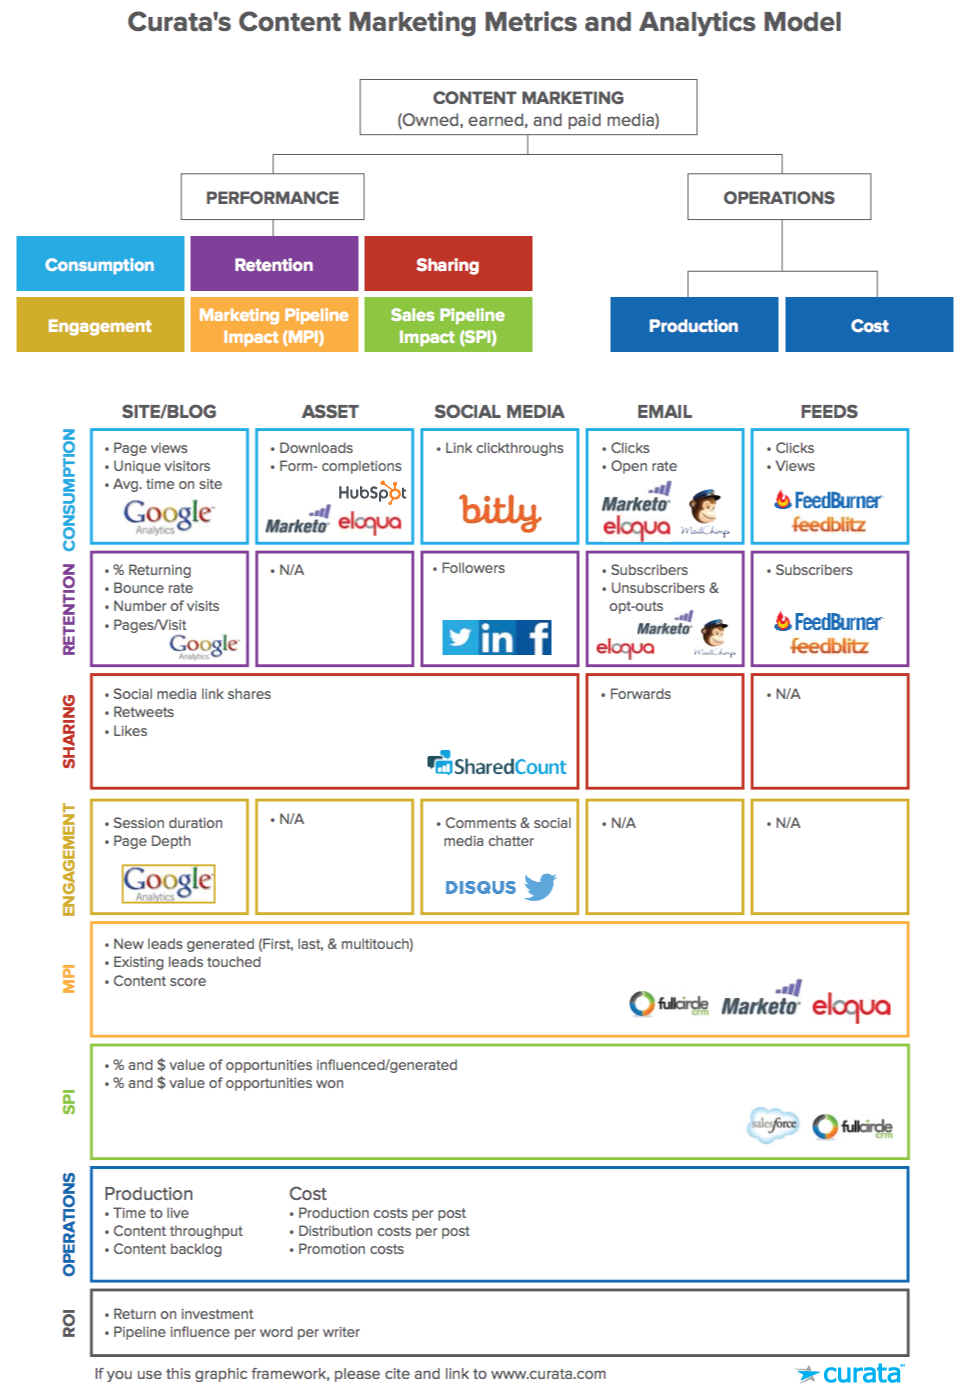
Next, we will walk through how you can compute these marketing metrics for each part of this model.
PERFORMANCE METRICS
Consumption Metrics
As discussed earlier, consumption metrics can answer the following types of questions:
- Are people consuming my content?
- Which channels are they consuming my content on?
- What are their content consumption behaviors and preferences?
Let’s take a look at what the different consumption metrics are by channel.
Site & Blog
For a site or blog, the most important consumption metrics are page views, unique visitors, and average time on page:
- Page view analytics tell you how many and which of your content pages your visitors are consuming.
- Unique visitor analytics help you get a sense for the overall size of your audience and how much of your traffic is repeat visitors.
- Average time on page analytics give you insight into how people are consuming your content. Are they reading or viewing the content thoroughly or are they quickly skimming?
Each of these statistics is easily available via Google Analytics or a similar web analytics tool.
 SHERRY LAMOREAUX
Writer/Editor, Act-On @SherryActOn
“I have different metrics for different channels. For the blog, I keep track of unique users and page views, and I’m more concerned about trend than absolute numbers. I like to track which posts and topics generate the most interest; we’re always interested in what people want to read. For our downloadable assets such as white papers and eBooks, particularly the high-value ones we gate, the numbers that really matter are conversions and closed sales. If an asset is working well, we’ll keep it gated. If it’s not generating results, we’ll un-gate it. We also track linking domains.”
Assets
You can get a good idea of the consumption of downloadable assets such as PDFs of white papers or eBooks. Simply keep track of how many times an eBook is downloaded.
For gated content—content locked behind a landing page—you can measure form completions. In other words, how many times someone fills out the form completely and with valid information.
 ROB YOEGEL
VP of Marketing, Gaggle @RobYoegel
“The most success I’ve had is looking at conversion metrics (downloads/registrations) and website traffic (blog posts) from traffic sources. Either in aggregate (i.e., social vs. search. vs. direct) or by a specific website, campaign, etc. By analyzing the source of conversions/traffic, you can better understand what content resonates and what audiences are valuable to the business, assuming you can track them through to a sale.”
Form Completion Problems
Marketing automation systems such as Marketo, Eloqua, Pardot, and Act-On each include a feature to measure form completions. However, accurately measuring actual downloads—while arguably more important because it encompasses both gated and ungated content—is more difficult for two technical reasons:
-
Marketing Automation does not track asset views. Most assets, specifically PDFs, are not tracked as lead activities. Furthermore, you cannot place a munchkin or tracking code on such files, so they are invisible to both marketing automation and web trackers such as Google Analytics.
-
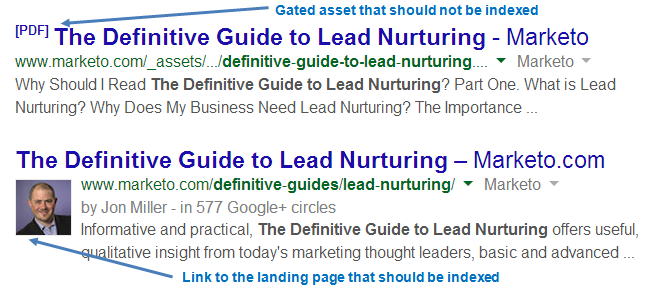
They exclude form bypasses. You may assume that everyone downloading an asset has completed a form already. In reality, a significant percentage of visitors may have bypassed the form, particularly if it is indexed by a search engine.
For example, Marketo can (but does not) tell search engines not to index gated assets, so they often end up showing up in search results. The screenshot below shows a Google search results page for “The Definitive Guide to Lead Nurturing.” The landing page shows up second, but the direct link to the PDF shows up first.
Therefore to track assets, you have to either:
- Use a flash-based PDF viewer like Zmags. These types of viewers include design and publishing tools as well as tracking features that give marketers insight into download data, and can also track reader eye movements to create viewing heat maps.
- Rely on softer indicators such as form completions for the landing page, page views on the post-form completion thank you page, or click-throughs on the email that links to your asset after form completion.
Social Media
Unfortunately, there isn’t a completely accurate way to measure how many people viewed a particular social media post. Some social platforms and third-party management tools provide “reach” or “impression” stats. These attempt to measure how many people your content was potentially exposed to. But just because a piece of content could have been seen, doesn’t necessarily mean it was seen. Things move fast on social media feeds, content shelf life is short, and many posts go unseen by the majority of users.
You can, however, measure how many people clicked a link within a social media post, which serves as a fairly accurate measure of consumption. The easiest way to measure click-throughs is a link-shortening tool with analytics capabilities such as bit.ly.
Emails
Because you cannot embed analytics trackers in emails, you cannot get a true measure of content consumption. In lieu of actual consumption data, you can look at open rates and click-throughs. Marketing automation platforms such as Eloqua, Marketo, Pardot, Act-On, etc. commonly report both metrics, along with email marketing platforms such as MailChimp, Constant Contact, etc.
Warning! Open rates and click-throughs are only proxies for consumption. They have several limitations:
-
When a hidden image in an email is loaded, Open rates record an open. But many email clients don’t load images for spam protection. Open rates are consistently underreported for this reason. They can also make image-heavy emails such as infographics appear to perform better than others. They entice a recipient to load images, even though the content is not necessarily more appealing.
-
Click-Through rates only reflect the number of clicks on an embedded link. This data can help you understand which calls-to-action are most appealing. But many recipients gain value from email content even without clicking links. For example, if your emails include the full text of articles, your click-through rates will underreport consumption as a reader can consume your content without leaving the email.
 BARRY FELDMAN
Founder, Feldman Creative @FeldmanCreative
“I’ve been operating with the mantra ‘the money is in the list’ for a year or more, so my top priority for measurement is the growth of my email list. Beneath each of my posts (and also in the blog page sidebars) are email opt-in forms. Now, I should say that many visitors are there to read my posts because they’re already on my email list. However, for a big picture metric of how my content performs both for “pull” and on-site, I look at my email list. I call an email opt-in a conversion.”
Feeds
Feed consumption statistics (primarily views and click-throughs) are measured by wrapping your feed URLs with those provided by FeedBurner or FeedBlitz.
However, if you wrap your feed URLs with an analytics-provided one, they only measure feed consumption for readers who subscribe to your feed after you have added the tracking URL. You won’t capture the consumption behavior of readers who subscribed to your original, untracked feed.
Retention Metrics
Retention metrics give you the ability to track how well you are able to hold onto your audience after a visit. They can answer the following types of questions:
- How many people are coming back to consume other content?
- What amount of people are subscribing to receive future content updates?
- How often are they coming back to consume other content?
Comparing consumption and retention metrics helps you understand whether your content is inspiring your audience to keep in touch and expand their relationship with your brand.
Let’s look at measuring retention on each online channel.
Site and Blog
For a topic-specific microsite or blog, you can measure blog retention by tracking the following metrics using Google Analytics:
-
Percentage of Returning vs. New Visitors. It’s good to have a healthy mix of both returning and new visitors. If your returning visitors percentage is low, you are attracting a lot of new visitors, but few of them come back. If your traffic primarily consists of returning visitors, you are retaining traffic well, but not attracting new people.
-
Bounce Rate. Bounce rates don’t measure retention across visit sessions (unlike the percentage of returning visitors). They measure retention within a single visit. It’s entirely possible to have a low bounce rate and still be unable to attract a visitor back to your site for another session, or vice-versa. Optimize for both independently.
Note: When it comes to content curation analytics, remember that unlike created content, curated content does not live on your site or blog. You are intentionally bouncing visitors to a third-party site to consume the original content, so this can inflate bounce rates.
-
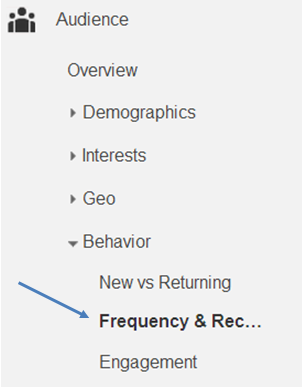
Number of Visits and Days since Last Visit. One of the less common statistics to keep an eye on is the number of visits, and how long it was since the last visit. To track this, log into Google Analytics, click on Audience, then Behavior, then Frequency & Recency as shown below.
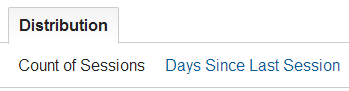
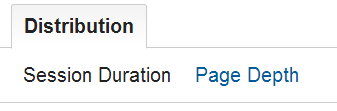
Now you can toggle between Count of Sessions (how many times they visited) and Days Since Last Session (how long it’s been since they came back) under distribution, as shown below.
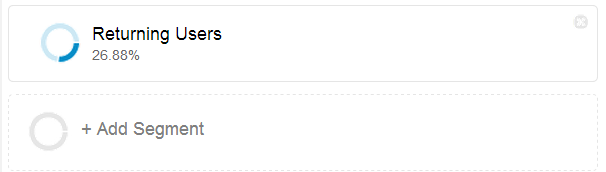
It’s normal for the vast majority of readers to only visit once. To better analyze returning visitors, add a segment and just filter by returning visitors (see below).
Assets
For assets, there’s no easy way of tracking retention directly, so we will just skip this.
Social Media
The primary means of retaining a visitor on social media is being “followed” by them. This way they get updates and hopefully come back to your site. To track follower growth over time, there are many services such as Twitter Counter available. If you run a Facebook page, you can use the internal analytics tools to monitor audience growth.
You can track existing email list subscriber retention by keeping an eye on unsubscribes and opt-outs. Similarly, you need to track new subscribers to see if you can grow your list at the same time.
You can combine these two metrics to see if you have a leaky bucket by looking at your list size week over week. Are you losing more subscribers than you’re gaining? If your opt-outs exceeded your weekly new visitors, you are in trouble, and may need to have more engaging content in your emails, or reduce the frequency of your emails.
 ROBERT ROSE
Chief Strategist, CMI @Robert_Rose
“Understanding how you are drawing in your different influencer and buyer personas toward a common content marketing mission is perhaps the most important first goal of any approach–and will give you a great early indicator of future success. So, mostly that looks like a registered or “known subscriber” metric–and also provides some indication of “quality of audience” as well.”
Feeds
Similarly to emails, you can measure the number of feed subscribers to gauge retention. This can be done using a feed analytics tool such as FeedBurner or FeedBlitz.
Sharing Metrics
People share content because it is useful, entertaining, and/or informational. They only share content if its quality reflects well on them, so if your content is earning shares that’s an excellent indication you are producing content your audience wants.
Site and Blog, Assets and Social
When it comes to tracking sharing metrics for sites, blogs, assets, and social posts, the metrics to keep track of are all pretty similar, but the key metric to track is Social Media Shares. Use a tool like SharedCount for a unified and consolidated statistic on the number of shares across all networks. That’s regardless of whether the user shared directly via the social media channel, liked or retweeted someone else’s post using a share button on your content, or used a meta-sharing tool like Buffer.
The type of asset you share will determine the platform it is best shared on. For example, the minimum ideal length for articles shared on Twitter is approximately 500 words, with articles on the higher end of the spectrum (1400+ words) driving the most average engagement, according to Atomic Reach.
 HEIDI COHEN
Chief Content Officer, Actionable Marketing Guide @HeidiCohen
“Content marketing metrics must be tracked back to your specific business goals. Each goal often requires a series of smaller steps and objectives that contribute to romancing your prospects into ultimately purchasing from your organization. Due to the complexity of today’s marketing and the number of potential buyer paths, don’t rush to attribute sales entirely to the last platform touched. Platforms such as social media may contribute to your results but not yield quantifiable contributions. Where appropriate, incorporate a call-to-action to aid tracking.”
If you receive great content in an email newsletter and want to share it, what do you do? More often than not you forward the email to someone and write a note up top. Unfortunately, such forwards cannot be tracked or measured.
Forwarded emails can be tracked—not natively through an email client—but by clicking on a forward-to-a-friend button or link embedded in an email. However, even though some marketers wishfully include these in emails, they are rarely used by recipients. So for all intents and purposes, sharing over email is not measurable.
Feeds
Since users don’t typically share feeds, sharing metrics don’t apply to this channel.
Engagement Metrics
 BETH KANTER
Social Media Expert, @kanter
“The most important metric for me is the number of speaking engagements or training projects I get hired to do, but leading up to that I have to look at how my content is engaging audiences and reach.”
While closely related to consumption and retention metrics, engagement metrics are also slightly distinct. Here are a few things you may want to track when it comes to engagement:
 NEIL PATEL
Founder, Quick Sprout @neilpatel
“The one metric I really look at is comments per post. It tells me how engaged an audience is. No matter how much traffic you have, if you can’t cultivate an engaged audience you won’t be able to convert those visitors into customers.”
Session Duration
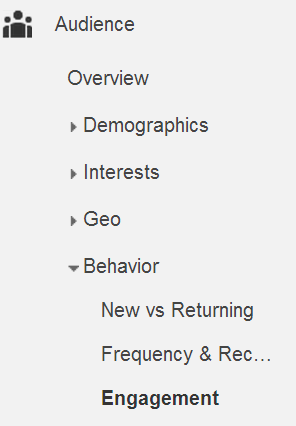
Session duration lets you know how long a visitor stays on your site during a given visit across multiple pages. Others call this dwell time. To measure this, log into Google Analytics, then go to Audience, then Behavior, then Engagement.
Page Depth
This shows you how many pages your audience visits per session. Are they just reading one piece of content and then leaving? Or are they very interested and consuming several pieces of content? You can find this information in the same view in Google Analytics by clicking on the Page Depth link.
 LARRY KIM
Founder/CTO, WordStream @larrykim
“One important new metric I started tracking recently for content marketing is reader feedback. For example, are you getting fan mail from people who are blown away by your content? Are your readers reaching out to you to connect on LinkedIn? How enthusiastically positive are your press pick-ups? There’s a lot of content out there and so it’s important that your content stand out from the rest—these types of reader sentiment metrics can give you an indication if you are succeeding or not.”
Comments and Social Media Chatter
Many people consider comments to be an important metric of engagement. Others have contested this assumption, arguing most conversations don’t happen onsite. Rather, those discussions take place on social media channels. Regardless, get a handle on engagement by counting reactions and interactions with your content, whether comments or social media discussions.
Lead Metrics
Lead metrics help you track and measure middle-of-the-funnel activities in a way that enables you to attribute leads in your marketing automation system to specific pieces of content.
 DHARMESH SHAH
Founder/CTO, HubSpot @dharmesh
“The most important metric for us in measuring the success of our content efforts is number of qualified leads. We make considerable investment in content creation—particularly our blog, which represents a major component of our overall inbound marketing. The most important result of those efforts is qualified leads that we can then pass along to our sales team. We’ve found that the cost for leads generated through our content efforts are lower and the quality is generally higher than our paid channels, so we continue to increase our investments in this area.”
Campaign Tracking
The easiest do-it-yourself means of associating content with leads is to set up campaign tracking in Salesforce and your Marketing Automation platform. It can be an initially complex process, but it’s certainly possible and the insights gained are worth your while.
A campaign is an object in Salesforce that stripes across Lead objects, Contact objects, and Opportunity objects. First, for each piece of content, you create a campaign in Salesforce. Then, when a particular marketing event occurs (e.g. opening a newsletter, reading an article, or downloading an asset), your marketing automation system can associate the record of the lead with a campaign representing the activity performed.
The following image should help you visualize the process:

There are three powerful attributes of campaign tracking that help with content attribution:
-
Persistence. Once a lead is attributed to a campaign, campaign mapping follows the lead. This holds even as the lead is converted to other objects lower in the funnel, such as a contact or opportunity. It lets you track not only how many leads a piece generated, but also whether these leads resulted in further actions.
-
Multiple Attribution. You can associate more than one campaign with a lead record. This lets multiple pieces of content get credit under a multi-touch attribution model (more details on what this is later).
-
Time Stamping. You can replay content consumption when a lead-campaign association is time stamped. For example, you can ascertain the last piece of content a lead viewed prior to converting to an opportunity.
 ARNIE KUENN
President, Vertical Measures @ArnieK
“Without a doubt, the most important metric is lead conversions.”
 JASON MILLER
Global Content and Social Media Marketing Leader, LinkedIn @JasonMillerCA
“At the end of the day why are we doing this? The answer is for more leads. If the leads that are coming into your pipeline are more qualified based on the engagement with your content and are closer to buying, then your content strategy is working.”
Campaign Reporting
Once you have implemented campaign tracking, you can then generate reports or use a Salesforce plugin like Full Circle Insights to analyze campaigns.
The types of questions you can now answer include:
- How many new leads did a given piece of content generate?
- Which pieces of content helped convert leads lower into the funnel?
- How many existing leads in my database touched a particular piece of content?
- In which areas of the funnel do we not have sufficient content?
 MARCUS SHERIDAN
Founder, The Sales Lion @TheSalesLion
“For me, the most important metric is number of pages read per lead. Why? Quick answer: in 2012 my swimming pool company compared the leads on the site that had bought a pool vs. the ones that ended up not buying (both had filled out contact forms). As we looked at the analytics comparing these two groups, we found that when leads viewed 30 or more pages of the website before our initial sales appointment they would buy 80% of the time, an astronomical number in the industry. I firmly believe every business has their own “content tipping point” when it comes to leads converting to customers. This is exactly why today I help all of my clients attempt to learn what their tipping point is, and how they can help their leads reach said metric to dramatically impact the sales process.”
Sales Metrics
 DAVID MEERMAN SCOTT
Online Marketing Strategist, @dmscott
“How’s sales? Ultimately content marketing drives sales success.”
If you have set up campaign tracking properly in your CRM (as described in the previous section), the campaign associations will also apply to opportunity objects. This will enable you to generate many other powerful sales reports.
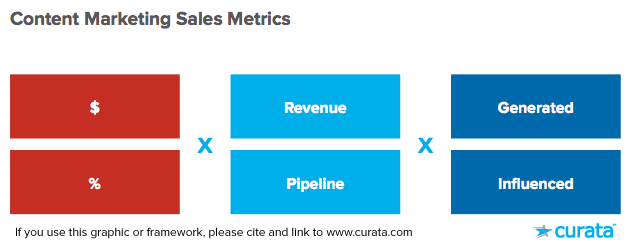
By picking one choice from each column in the chart above, you can calculate some helpful sales metrics including:
$ of Pipeline Opportunities Influenced
This tells you how much of the sales pipeline was influenced by consuming one or more pieces of your content. You can report on this metric for a single piece of content, over several pieces of content in a content marketing pyramid, or for all content across the board.
 MIKE VOLPE
CMO, HubSpot @mvolpe
“Revenue. And anyone that says you can’t attribute new customers and revenue down to a single piece of content, like a blog article, is doing it wrong.”
$ of Revenue Influenced
In a similar manner, this number tells you the dollar amount of revenue closed where a contact associated with that opportunity consumed one or more pieces of content prior to the deal closing.
 DOUG KESSLER
Creative Director/Co-Founder, Velocity @dougkessler
“Revenue has to be the mother of all metrics. It’s what we’re here for, right?”
$ of Pipeline Opportunities Generated
You can use a first-touch attribution model to tally the total dollar amount of all opportunities. This is where first touch of a lead associated with an opportunity is from a piece of content your team created. If that’s confusing, think of it as reporting on the amount of sales you ultimately generated because a prospect found you through your content.
 JEFF ROHRS
VP of Marketing Insights, ExactTarget @jkrohrs
“As with any marketing activity, the number one metric we should be paying attention to is how does it positively impact sales. Whether directly or by influence and loyalty, content marketers must deliver measurable value to the organization.”
$ of Pipeline Revenue Generated
This is very similar to the prior metric but only measures opportunities won. This is often considered the ultimate marketing metric. It counts dollars at the bottom of the funnel that marketing generated; it cannot be easily gamed or fudged.
 IAN CLEARY
Founder, Razor Social @IanCleary
“My most important metric for my content marketing success is revenue generated. My path to revenue is driving relevant traffic to my site, building an email subscriber database and then converting the email subscribers. For example, I run webinars where I invite email subscribers and then make sales on the webinars. My other key metric is my email conversion rate and I measure my conversions rates from social media channels, social advertising, referrals, organic and direct traffic.”
Percentages
For each of the above, you can also generate percentage variants of these metrics to show the impact of marketing on sales. When trying to justify your content marketing team’s existence, these statistics go a long way. Here’s a few percentages you can report on:
- % of Pipeline / Revenue Influenced by Content
- $ of Pipeline / Revenue Generated by Content
 LEE ODDEN
CEO, TopRank Online Marketing @leeodden
“While all marketing roads must eventually lead to revenue, the single most important metric for content marketing success is the one that measures the goal you’re after. It would be easy to say that goal is customer acquisition, sales, revenue or profit. But content marketing programs can deliver results on a variety of objectives that create value for a business. For example, using content marketing to grow thought leadership can increase unsolicited media inquiries. Coverage in industry publications citing your company’s expertise can affect both brand perception as well as sales.”
OPERATIONAL METRICS
Production Metrics
Production metrics are wholly different from the other marketing metrics we’ve covered here. Rather than measuring the performance of your content, they measure the performance of your content production operation. Here are some metrics you may want to measure:
Time to Publish
How long does it take your team to transform a content idea to a live published piece of content? This metric is similar to measuring the length of a sales cycle for a lead. It captures the speed of your content marketing team.
Track this by keeping one column on your editorial calendar for when an idea is conceived, and another for when it’s published. Calculate time to publish by taking the difference of the two dates.
 CHRISTOPHER STELLA
Senior Marketing Director, Siegel+Gale @CStella
“One of the most critical metrics at this early stage of our content marketing program is employee participation. Because we are a professional services organization, content creation needs to be a team sport—our subject matter experts must publish their unique points of view to differentiate our brand in a competitive space. This year, approximately 40% of our employees contributed original content to our blog, and many more have published articles. That number is growing. Seeing so many colleagues eagerly join our bench of content creators is both exciting from a cultural perspective, and critical to our firm’s success.”
Content Throughput
You can measure how many pieces of content or words you are publishing in a given period of time. Or for a single writer, you can measure how much content they are producing in a given period of time. For stats like these on a blog specifically, you can try a WordPress plugin such as WordStats.
Content Backlog
You can also compare one metric against the other. For example, to ascertain whether you have a content production backlog, compute the Average Number of Days between Posts (a production metric) divided by the Average Days Since Last Visit (a retention metric).

If this number is greater than one, you are producing content quicker than your average visitor can consume it. Should the number be less than one, your visitors are hungry for more content and you are not producing content quickly enough. If you are at approximately one, you are producing content at the right velocity.
 RYAN SKINNER
Account Director, Velocity Partners @rskin11
“Of one thing you can be certain in content marketing: your first efforts will almost definitely be your worst. And your current efforts will be eclipsed by later efforts. Everyone improves. What sets great programs apart from mediocre ones: the rate of improvement.”
Cost Metrics
Like production metrics, cost metrics track production efficiency. They look exclusively at the financial costs of content marketing however, or the “I” (investment) part of ROI. Here are a few good places to start:
Production Costs per Post. If you use freelancers to write content, it should be easy to track the cost per post based on their invoices. It gets harder to account for this if you track full time internal resources.
Distribution Costs per Post. Many people assume that content distribution is free. But with more and more content online, distributing it is getting expensive—sometimes more expensive than the cost of producing the content. Here are some distribution costs to consider:
- Social Media Promotion. Time and equivalent pay spent on promoting your content.
- Influencer Marketing. After you have created your content, you may be outreaching to influencers to notice your post. This has a cost that has to be accounted for.
- Native Advertising. If you are using native advertising networks like Outbrain or Taboola, these costs should be factored in as well.
ROI Metrics
Last up are my favorite class of marketing metrics: the holy grail—ROI metrics. These combine different classes of the aforementioned marketing metrics with a broad range of variations. Here are a few you may want to consider.
Return on Investment
For each piece of content x in Campaign C, take the $ amount of Revenue generated (a sales metric) by Content x and divide it by the ($ Production Cost for x + $ Distribution Cost for x) (a production metric). If the ratio is greater than 1, your content was profitable from a sales perspective. You can similarly compute this for a single piece of content, or all your content marketing. 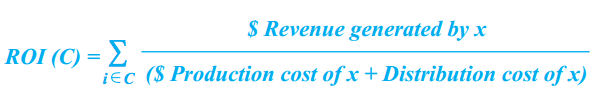 Alternatively, C can represent all content produced by a particular writer, and the calculation will give you the ROI for that individual. If their ratio is less than 1, they may need to up their quality and/or quantity of content produced. Take this with a grain of salt however, since there are a lot of other variables that influence revenue.
 JIM LENSKOLD
President, Lenskold Group @jimlenskold
“Average Value per Customer. The power of content marketing goes far beyond generating leads. It is critical to measure the increase in the Average Value per Customer to reflect content marketing’s effectiveness in educating buyers and differentiating the brand in order to increase purchase volume and earn long-term loyalty. This additional profit margin generated helps to justify the ROI of higher-cost content that truly improves the quality of the lead and the customer relationship.”
Pipeline Influence per Word per Writer
For all content produced by a given writer denoted as W, sum over the total pipeline influence for each piece of content x divided by the word count of x. Now you get a metric in the units of pipeline dollars per word. 
This is useful because some content writing services charge by the word. If you find their pipeline influence is less than their cost per word, it may be time to try another service provider.
 CYRUS SHEPARD
Content Astronaut, Moz @CyrusShepard
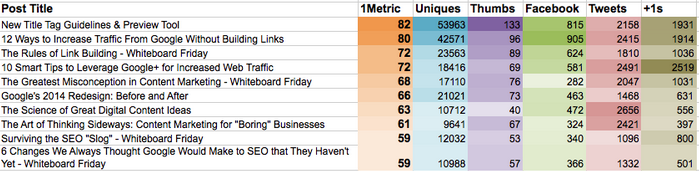
“Because it’s hard to choose a single measurement of content performance, we actually invented a score called 1Metric which combines several different factors into a single number. You can configure it different ways, but our 1Metric combines traffic, social shares and link data into an algorithmic score between 1-100. By focusing on a single number, we eliminate outliers and gain a much clearer picture of our content success metrics. We’re testing this internally and may release a public version soon. Here’s a screenshot:
Where to Go From Here
Set up a “dream dashboard” that includes all the marketing metrics you hope to eventually measure. Start by implementing the ones at the top of the funnel (retention, engagement) and work down. Once all metrics are consistently measured, you can create the following changes to content marketing operations:
- Incentivize your team. Hold your content marketing team accountable, right down to individual writers, for achieving not only a certain level of content output, but also a certain level of content performance.
- Diagnose and troubleshoot. Content marketing metrics let you effectively diagnose when things don’t go as planned. For example, if your data tells you content is effective at the top of the funnel, but isn’t producing high quality opportunities at the bottom of the funnel, this may indicate you need better calls-to-action.
- Create alignment between divisions. Walls between different functions suddenly crumble if there is a singular focus on one ROI-based content marketing metric—particularly if team members are compensated on it—and teams find new and more effective ways to collaborate.
If you’d like to quantify a content marketing career, download LinkedIn and Curata’s joint eBook: The Ultimate Guide to a Content Marketing Career.