- Share Content Marketing KPIs: Mapping Content’s Organizational Influence on Facebook
- Share Content Marketing KPIs: Mapping Content’s Organizational Influence on Twitter
- Share Content Marketing KPIs: Mapping Content’s Organizational Influence on Linkedin
- Share Content Marketing KPIs: Mapping Content’s Organizational Influence via email
Are the content marketing KPIs you use selling your work short? Are you struggling with how to better quantify content marketing’s impact on your organization, especially when it comes down to dollars? It’s okay to admit it; you’re definitely not alone. Content, although named king just a few years ago, now seems to be scrambling to make sure the emperor does, in fact, have clothes. So what’s the problem?
The expectations for a content marketer’s areas of expertise have inflated in every direction. We’ve needed to evolve into masters of multiple formats as diverse as blog posts, whitepapers, social media, webinars, videos, podcasts, snaps, and other assorted forms of micro content. This multiplicity of formats and channels also means that the role of the content marketer has expanded from the traditional roles of writer and editor to include designer, videographer, and often ad hoc website developer among others.
What’s more, content marketing has become more operationalized, making organizational skills such as project management, people management, technology evaluation, and especially data analyzation increasingly important. Even the title of “content marketer” might be somewhat outdated given that we support not just marketing in all its permutations, but also sales, customer success, HR, and any number of other departments or initiatives at our organizations.
With such a diversity of channels, roles, and spheres of influence, content marketing KPIs can be very difficult to define.
Content Marketing Influence: Hiding in Plain Sight?
But content’s omnipresence ironically might be responsible for making its full impact opaque. Most marketing analytics and attribution tools are focused on a specific function or point in the funnel (such as SEO, acquisition, or demand generation) instead of measuring the impact of the content that all of these functions utilize. It’s like David Foster Wallace’s famous anecdote about the invisibility of ubiquity.

Content Marketing KPIs: Siloed Data, Siloed Knowledge, Siloed Access
For many of us, trying to measure the ROI of content marketing is like trying to measure water in the ocean: overwhelming and too slippery to pin down. Think of all the different types of data a marketing team may use to determine what a successful program looks like: search position, social shares, pageviews, conversions, MQLS, opportunity value, and revenue. These are all different types of data using different systems used by different teams for different purposes. Sounds insane, right? Yet here we are. And this problem is compounded for the content marketer because none of these things are actually meant to measure content marketing KPIs, at least not primarily or fully.
What’s even more pernicious is that not only is data across different marketing functions siloed, but so is access to and knowledge of these different systems. The majority of content marketers are focused on creating, managing, and distributing ever-increasing amounts of content on an ever-increasing number of channels, not Salesforce. And the folks who are responsible for the complexities of marketing automation or CRM systems are typically focused on lead and account performance, not content’s influence on those leads and accounts. So when it comes to content marketing KPIs, their point of view is often limited to conversion rates of gated content items, not all the links the chain that might have lead up to that conversion.
Create a Content Marketing KPI Structure That Fits With Your Business Model and Culture
All of these missed connections results in a very limited perspective on content marketing’s impact. For the content marketer, that means that we are often perceived as an internal service organization instead of as a strategic partner equal to acquisition or lead generation. If that sounds familiar, then one of your main goals should be to work to change that perception. It can be a chicken-and-egg problem, but the best place to start is by developing content marketing KPIs that speak to your company’s business model and culture.
Understanding what your organization values, where content is playing a role, and how content marketing is perceived by both the marketing function and the wider business will allow you to map content marketing KPIs that are both comprehensive and readily received. It also helps you understand if you’re currently measuring the things that truly reflect your impact.
Inclusive content marketing KPIs allow you to prove content marketing’s value to your organization. But beyond proving your worth, the right KPIs will allow you to grow as well. You’ll be able to quantify and justify spend on your content program, perhaps even expanding your program to include additional content formats (like video) or improve the depth of your team’s design or coding skills with specialized hires.
Take Control of Your Team’s Time and Resources

Even more importantly, inclusive content marketing KPIs based on what you know works. Too many content marketers have to make guesses about what to create because their metrics are insufficient. Or even worse, content marketers may spend a lot of time creating content just to placate the “hunches” or opinions of people throughout the company. Sometimes these perspectives can be helpful, but other times it just sends the content team chasing their tails. A solid, data-based approach using the right content marketing KPIs gives you firm ground on which to make decisions about what and where to spend your team’s time and resources. Data-driven content creation will help earn your seat at the strategic table.
So how does the content marketer map KPIs that demonstrate content’s true impact on the organization?
First, you have to deeply understand your business. Discovering the answers to these questions is an essential starting point:
- What is your company’s business model? How does your company make money?
- What is your company known for? What does is want to be known for?
- Who are your company’s customers?
- What does your company value internally? (actions speak louder than words)
- In what ways is success defined for the business overall?
Once you’ve defined the big picture, hone in on marketing’s role within the business:
- In what ways does marketing contribute to the organization’s goals?
- How is that contribution measured today?
- Is the marketing function perceived as a service organization or strategic partner?
- What are all the different sub-functions within marketing?
- Are the marketing functions equally credited with driving marketing’s contributions? If not, which areas are credited the most?
Then dig into content’s role in both the marketing function and in the wider organization:
- What are content’s current responsibilities?
- What are content’s current KPIs? Do they encompass all of your responsibilities?
- How does content support all of marketing’s sub-functions?
- Do other business units utilize content that your team creates?
- Does your team create content specifically for these other business units?
Having insight into these questions will help you identify what your company values and how it defines success. You can also uncover any new opportunities to demonstrate content marketing’s impact through data.
Aligning Your Content Marketing KPIs to Success Stages

Revenue generation or revenue influence is the ultimate measure of success. However, it should not be the only measure. Some experts advocate for using revenue as the only metric, but I think this is over-committing. The revenue metric is the result of getting a lot of other metrics right along the way. Especially for businesses with long sales cycles, it could take months (or years) to get feedback on your work if your only measure of success comes at the very end of the cycle.
I recommend aligning your content marketing KPIs to the traditional funnel model, especially if your business is oriented around lead generation. Funnel models have certainly changed over the years with more and more complex stages. Start with a simple Top of, Middle, and Bottom reporting framework first. This will be easy to understand and share with others in your organization.
Strategic Content Marketing KPIs vs. Operational Content Marketing KPIs

One other thing to consider is that KPIs aren’t the only kinds of reports you’ll need. There’s a whole other class of reporting that I like to categorize as “operational” content reporting. Those are reports that help you make specific decisions: what to write, what to promote, what to socialize with your sales team. The following KPIs are intended to help you track your program’s high-level success and contribution to the business at each funnel stage. They are by no means the only reports you could and should create, but they are foundational and are the best candidates for an executive dashboard.
Content Marketing KPIs: Top of Funnel
These KPIs are intended to measure awareness and interest. For the content marketer that almost always includes both search and website metrics.
Average Position of Unbranded Terms
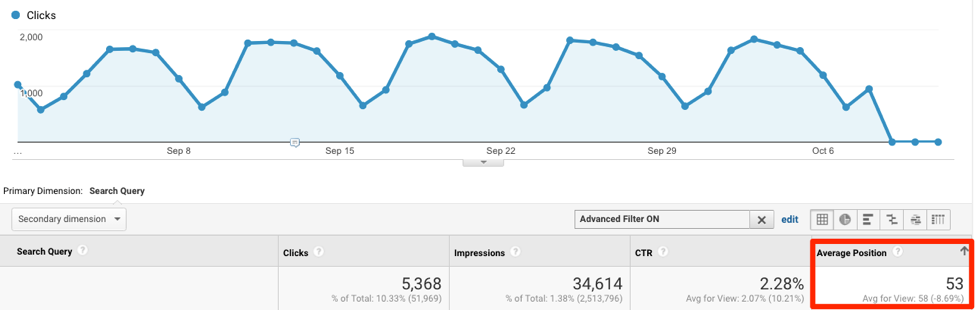
This query report based on Google’s Search Console data within Google Analytics shows the average position – or SERP (search engine results page) rank – of all the unbranded terms that a user types into Google to surface a URL from your website. The lower the number, the closer it is to the first position on page 1. From a KPI perspective, your objective should be to get that number as low as possible.
“Unbranded” means the search query does not contain your brand name. Most brands rank in the top spot for their branded terms. By focusing on unbranded terms, you can get a better line of sight into the performance of your thought leadership topics. Since this is taking into account all of your unbranded terms, the average position for all those terms may be quite high, especially if you are in a highly competitive space.
Another option for this report is to further refine unbranded terms into topic clusters. You can create reports that are focused on one keyword or a group of related keywords. This report is important because it tells you how competitive you are in the search channel via your position and if (via the CTR) users’ intent matches up with the content you are creating.
Percentage of Organic Users on Website
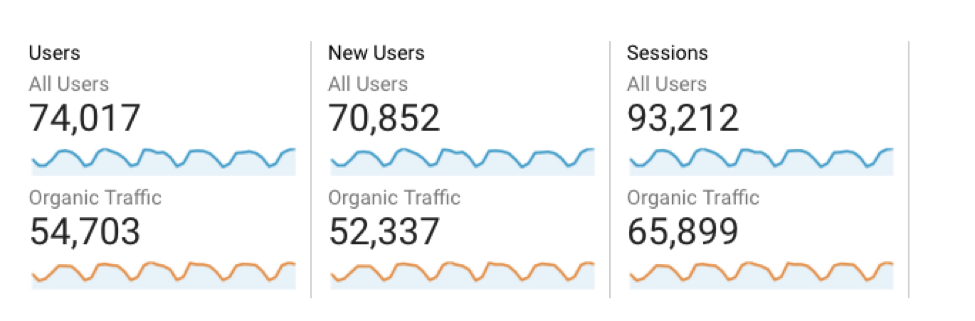
This report is based on Google Analytics’ Audience Overview. I added a segment of organic traffic (traffic on your website that came from search engines), to isolate the performance of that segment and compare it to overall traffic or even other segments such as display advertising. I think it’s most powerful to represent these numbers as percentages. Based on this example, you could report that organic accounts for 74 percent of all users (or unique visitors) and new users and 71 percent of all sessions (or visits) to your website.
Recently, top of funnel metrics like these have gotten a bad rap in the industry as “vanity metrics.” I think that’s a bit unfair. Sure, visits do not equal revenue (heck they don’t even equal conversions), but for most companies, there’d be no leads without traffic, no opportunities without leads, and no revenue without opportunities. At best, it is incomplete to only use top of funnel metrics as your indicators of success. But if you are using full funnel KPIs in the proper context, then I believe they have a place on your strategic content marketing KPI dashboard and in a data-driven content marketing strategy.
Content Marketing KPIs: The Middle of the Funnel
These are content marketing KPIs that meant to measure depth of engagement and intent to purchase.
Percentage of Organic Traffic That Converts
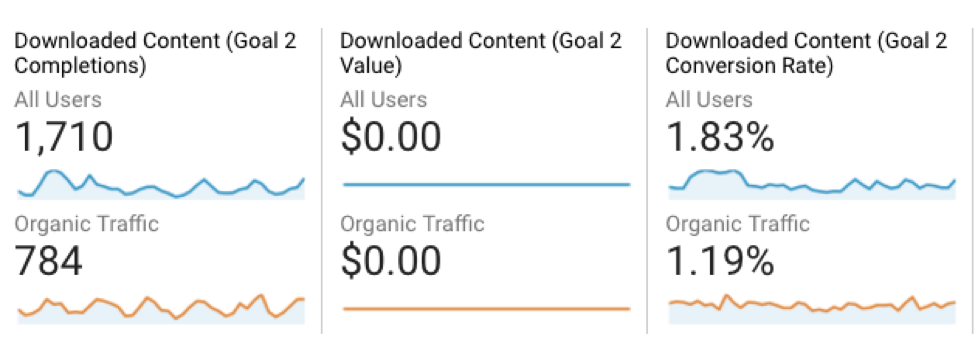
This is a Google Analytics conversion report that gets much more specific than the organic traffic report. In this example, the GA instance has many different options for goal completions. The goal many content marketers would interested in at this point are conversions from premium pieces of content: white papers, webinars, videos, etc. For others it might be a demo or contact request or a newsletter sign up. You could even run different reports against different website goals. Again, expressing this metric as a percentage of the whole allows you to quantify your impact.
One thing to note is that these conversions don’t necessarily equal leads. A conversion may be completed by an known lead or existing customer, therefore would not be a new lead. That’s why I consider this report a great measure of engagement and possible intent to purchase.
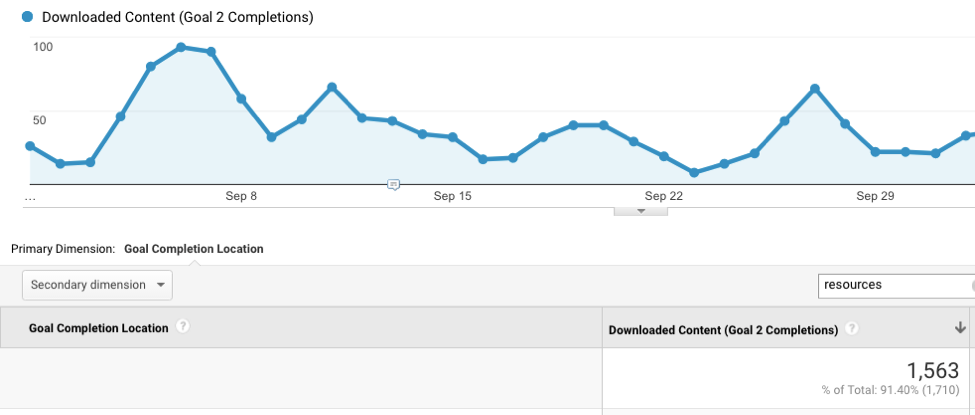
Another option for this report is to hone in on a particular area of your site, say, the Resources section that houses all your ebooks. Use a Goal URL report and filter by page path:
New Leads by Program & Asset
This Marketo report takes the concept of conversions a step further and allows you see how many new leads your premium content generated. Instead of using anonymous data like Google Analytics does, a marketing automation program such as Marketo will be able to show you the number of “New Names” your content generated versus names that might have already existed in your database. Post-conversion, those previously “unknown” leads are now “known” leads. Because you have to create a distinct Marketo program for every piece of content to get this performance data, most marketing organizations only create programs for premium or gated assets and not for ungated assets such as blog posts.
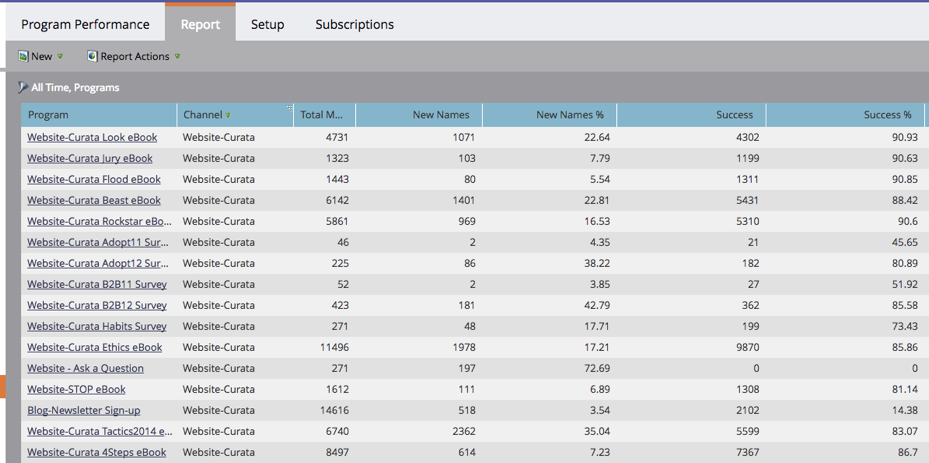
MQLs by Program & Asset
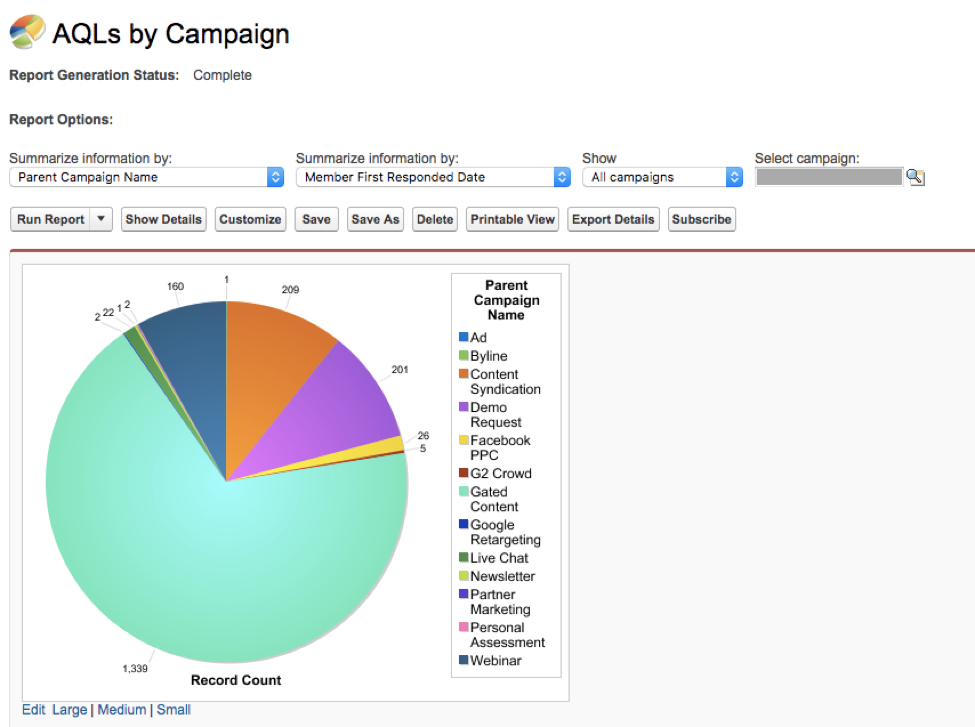
This Salesforce report takes the concept of a “new name” or a lead and takes it still a step further. An MQL (marketing qualified lead) or an AQL (automation qualified lead) are leads that go through a qualification process before marketing hands them off to sales. It’s an indication of both the quantity and quality of leads your content has generated.
These reports are similar, but the differences between them can tell you different things about your content. For example, if a content item is high on conversions but low on new names, then you may need to figure out a better way to reach new audiences. If a piece is driving a lot of new names but very few MQLs, then it might not be attracting the right kind of leads for your business.
Content Marketing KPIs: Bottom of the Funnel
These are metrics that measure content marketing’s influence on opportunities and revenue.
Pipeline Generated
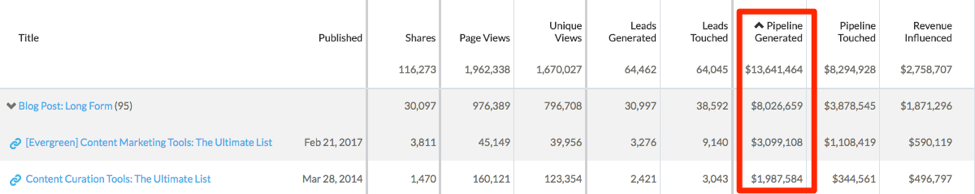
This Curata report uses advanced content metrics to show the dollar value of the pipeline created by content marketing. The report tracks all of the content consumed by a contact associated with an opportunity before the opportunity was created. Essentially it shows you how effective your content is at creating new opportunities. An important thing to note is that Curata can track gated as well as ungated content influence. If you are struggling to measure blog performance or connect any top of funnel content to bottom of funnel metrics, this type of report may be able to help.
Pipeline Touched
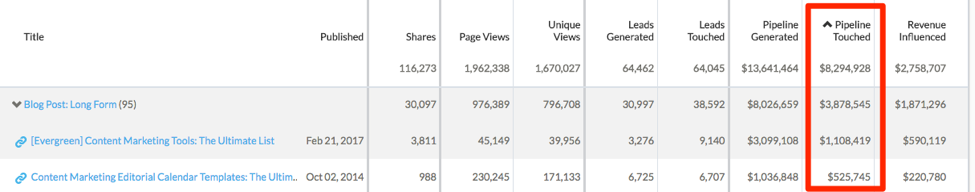
This KPI shows the total value of opportunities that were nurtured by content (again, all content both gated and ungated). The report tracks what the opportunities’ contacts consumed while the opportunities were open. This report tells you how much and which content items were part of the purchasing decision process.
Revenue Influenced
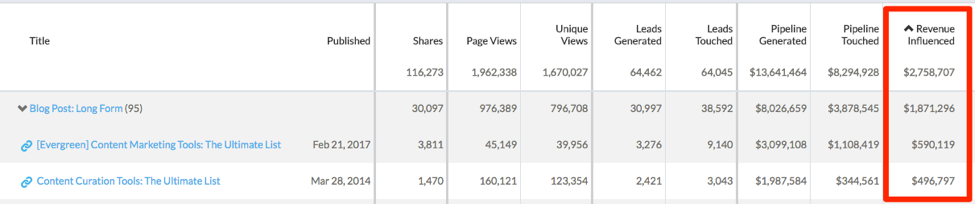
And here is the ultimate content marketing KPI: how to calculate content ROI. this report shows how much revenue is influenced by content marketing. The report shows the value of won opportunities where contacts consumed content anywhere along the journey prior to the opportunity close date.
Similar to the progression through the middle of the funnel from conversion, to lead, to MQL, these bottom of funnel KPIs show the influence of content through what has traditionally been thought of as the sales process.
Hopefully these suggestions for strategic content marketing KPIs for the top, middle, and bottom of your funnel points you in the right direction for building a strategic content marketing dashboard for your company.