- Share Generate More Leads with Data-Driven Content Marketing on Facebook
- Share Generate More Leads with Data-Driven Content Marketing on Twitter
- Share Generate More Leads with Data-Driven Content Marketing on Linkedin
- Share Generate More Leads with Data-Driven Content Marketing via email
For many of us, content marketing consists of a ‘throw-everything-against-the-wall-and-see-what-sticks’ strategy.
I have spent countless hours, days—even weeks creating content that just failed.
In fact, I even plotted every piece of content Curata has ever created in order to analyze how successful every item has been. This chart includes content types such as blog posts, webinars, eBooks, and case studies, across all channels: owned, earned and paid.
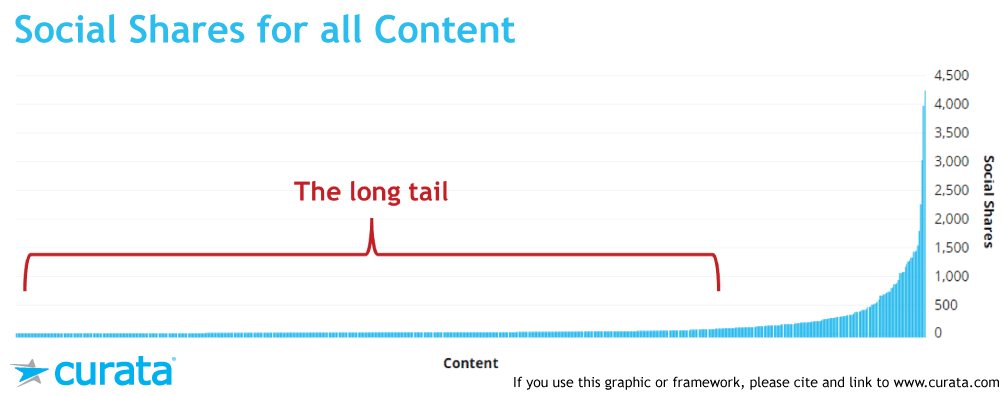
I found what I expected—there’s a long tail of “failed” content. And even when content is considered a “success,” it’s typically measured as being successful based on the number of social shares it got—as seen above, or page views, which do not necessarily impact the business.
But we can learn from our failures (and successes) to greatly improve the effectiveness of our content marketing. And we can demonstrably show how this has an impact on our business goals.
Both of these actions, however—learning from successes, and showing business impact—require data.
In this post, you will learn:
- How other industries use data to make decisions.
- How we created a data-driven content marketing strategy.
- How to get started on your own data-driven strategy.
How Other Industries Use Data to Make Decisions
Using data to inform future content strategy decisions is nothing new. Other industries have been using past successes and failures to make decisions for years. Here are two examples:
Digital Advertising
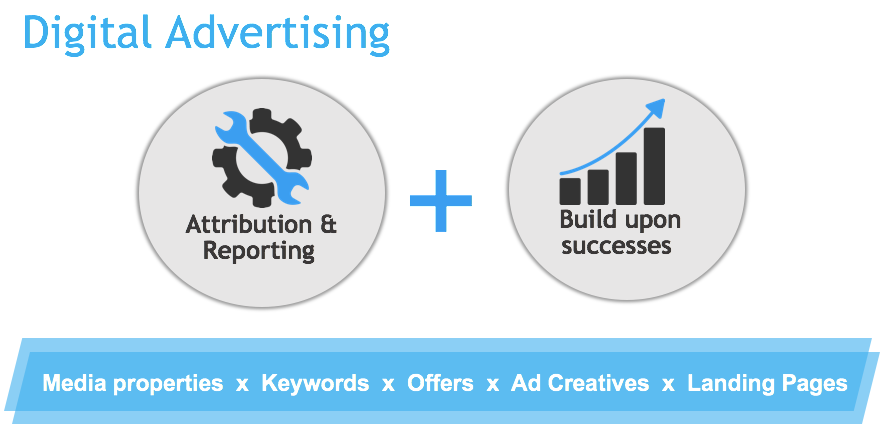
There is also a long long tail in digital advertising. Many digital advertising campaigns start with buying hundreds of thousands of ads across combinations of media properties, keywords, offers, landing pages, and ad creatives. The truth is however, despite all that effort, most will fail. But through data, campaigns can be made highly effective by focusing on the successes. Ad planners then typically prune 95% of the ads, and reallocate their budget on the 5% that perform the best.
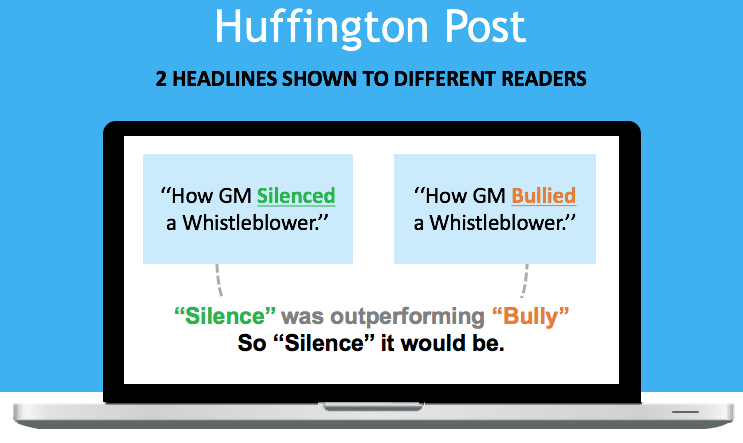
Journalism
The Huffington Post has become one of the most popular news sources online, largely through a data-driven content strategy. For example, they performed A/B testing between the headlines ‘‘How GM Silenced a Whistleblower,” and ‘‘How GM Bullied a Whistleblower’’ and found that “silenced” far outperformed “bullied.” This is the headline they used going forward.
While content marketers are not running the Huffington Post, there are a number of lessons we can learn about how to be more effective—and impactful—from data.
Before Implementing a Data-Driven Strategy
In 2014 Curata’s own marketing organization was not data-driven. We were intuition-driven, and more often than not—as we saw from the long tail of failures, our intuitions were wrong.
We would create content on a hunch, guessing what would work best. We tracked content performance based on the number of social shares and the number of page views. We measured our team’s performance based on how much content we produced in a given time period.
Ultimately we were unable to justify our content spend; we did it because we felt it was working. But just how much was working we didn’t really know.
Here’s how we used to track our data:
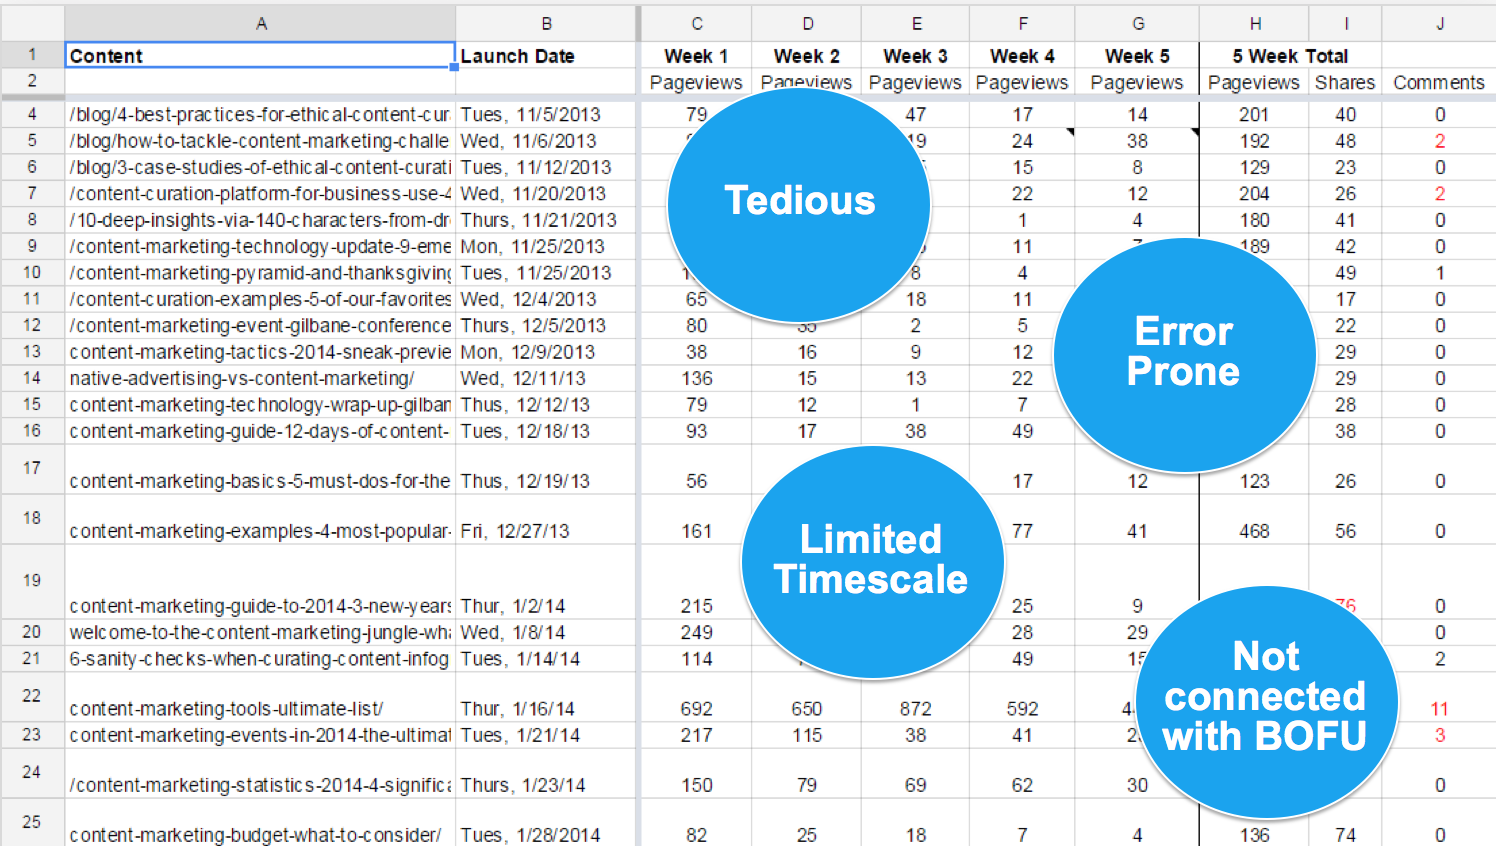
This spreadsheet took hours to complete, and at the end of the day, we were only tracking page views. We had no idea how our content was impacting the middle and bottom of the purchase funnel (i.e., marketing pipeline and sales pipeline). Worst of all, because it was such a tedious exercise to compile, we were only tracking content performance for the first five weeks rather than over its whole lifetime. Much of our evergreen content continues to generate the majority of our page views and social shares years after it was published—but we were oblivious to this.
How We Created a Data-Driven Strategy
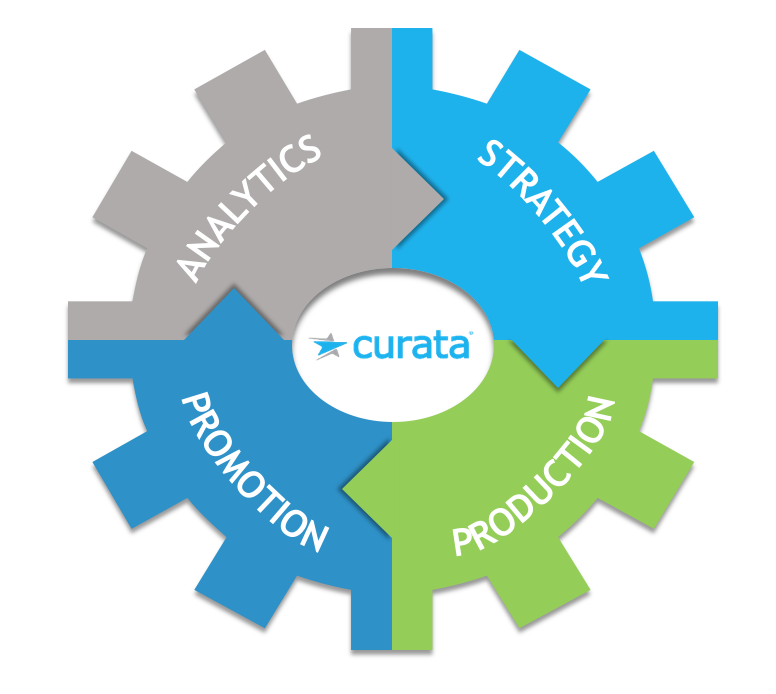
Since this method of analyzing content was tedious and ultimately insufficient, we decided to start from scratch. We wanted to use data to inform decisions across three areas of our content marketing process: strategy, production, and promotion.
We plotted out the key metrics we wanted to track and created the Content Marketing ROI framework below:
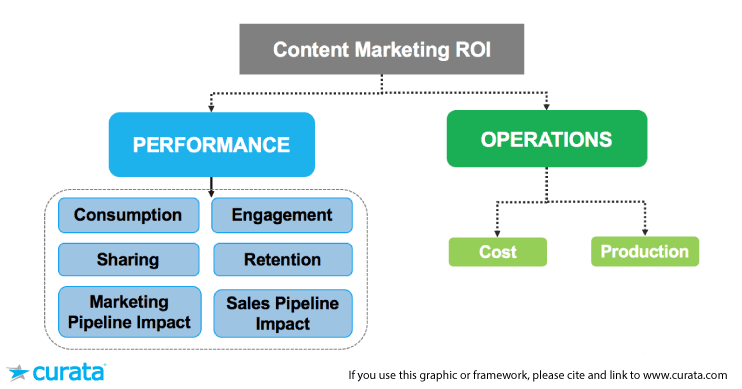
The goal is to measure our content marketing ROI. On the performance side, we chose the above six separate metrics to track. To learn how to compute each of these metrics, see Curata’s Comprehensive Guide to Content Marketing Analytics & Metrics.
Here is how tracking this data helped us make decisions in each of these main areas of our content marketing process.
1. Strategy
We were able to answer the following strategic questions:
- What topics should we create content about?
- What formats should we use for this content?
- What should be prioritized based on available resources?
Choosing Topics
To determine our topics, we used a variety of tools such as BuzzSumo. Data from these sources helped us determine which topics were being searched for and which topics were being shared.
But we didn’t rely on data alone. We also looked at our larger objectives as a corporation and determined a number of Content Marketing Pyramids to execute in the coming months.
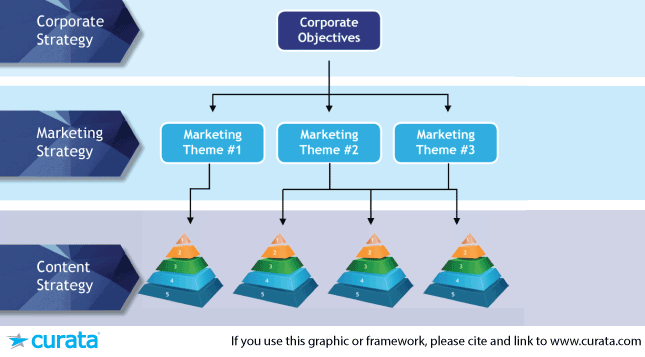
What is a Content Marketing Pyramid?
At a high level, a content marketing pyramid is a strategic framework for enabling the execution of a content program, assuring optimal content consumption, reuse and reach.
![]() To learn how to implement this framework today, download our 70+ page eBook on the topic: The Content Marketing Pyramid.
To learn how to implement this framework today, download our 70+ page eBook on the topic: The Content Marketing Pyramid.
Choosing Content Formats
Once we established our content marketing pyramids, we had to decide what format this content should be presented in. We wanted to know: Which content formats are the most effective and have the best ROI?
We were able to draw many conclusions with the data at hand. Here is one example that led to the largest change in our strategy:
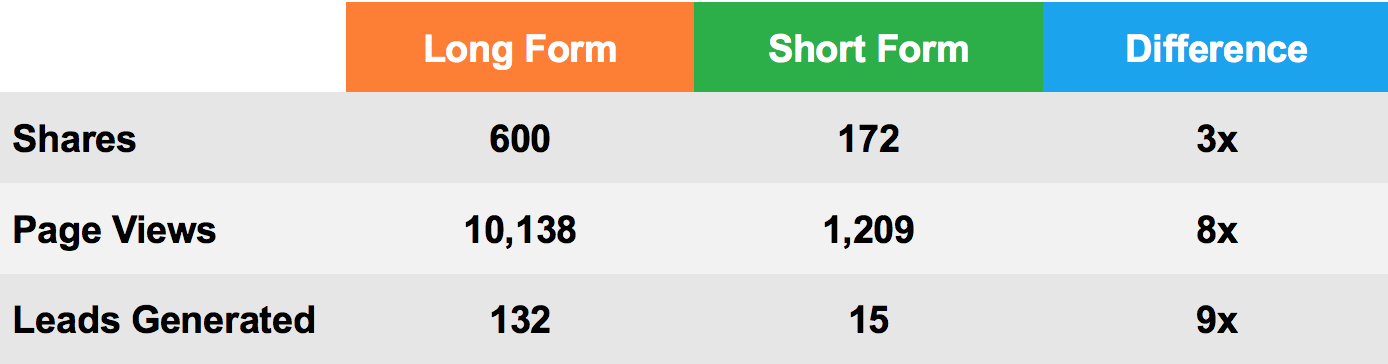
Focus on Long-Form Content over Short-Form Content
Previously, we created one short-form piece of content every week to send out in a weekly newsletter. Based on intuition, we thought this was the best strategy—it makes sense to create fresh information each week for your audience. Our data told us otherwise. We discovered that on average, long-form content generates eight times more page views, three times more social shares, and nine times more leads than short-form content.
This realization caused us to pivot our blogging strategy. Even though long-form content takes more effort, the results greatly outperform short-form content. We now exclusively write long-form content, even if we are only able to produce two pieces of new long-form content a month. (Check out more business blogging secrets here.)
2. Production
After forming a strategy, we moved on to production, where we used data to answer questions such as:
- Who should work on which content?
- What’s the status of our content supply chain?
Choosing Content Creators
To evaluate which content creators we should continue to use, we ranked all of our writers based on the average number of social shares they garnered for their content.
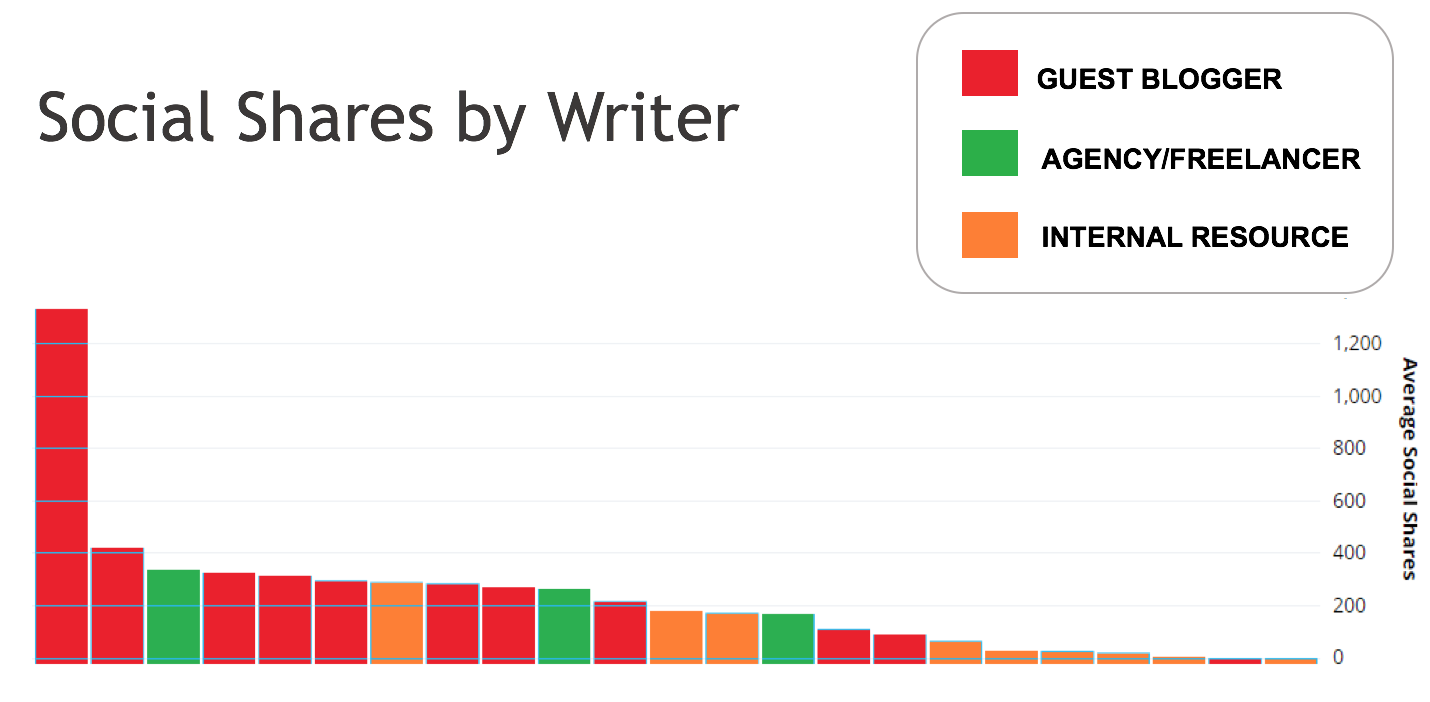
From this, we were able to prioritize which freelancers and agencies we should work with again, which guest bloggers we should invite to write for us again, and which internal employees were good content creators.
We also learned what didn’t work: the low producing creators on the right side of the chart. These are mostly people in non-marketing roles writing about a subject they specialize in. So instead of asking them to write for us, we have our dedicated content creators act as journalists and interview these employees for articles.
Determining the status of content supply chain
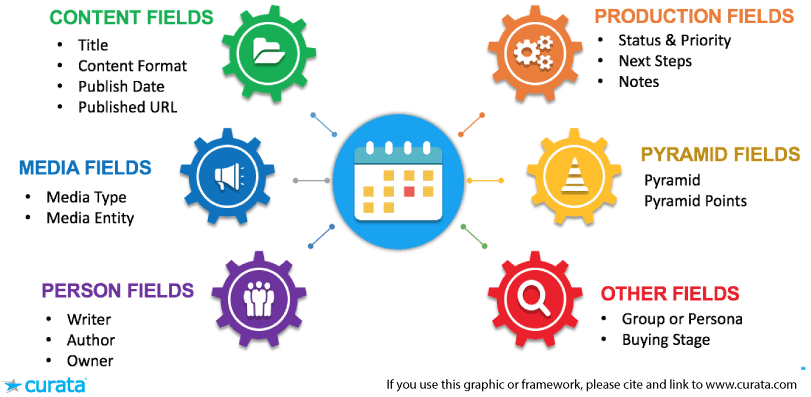
One key element of a data-driven strategy is maintaining a robust editorial calendar, which enables you to analyze data in multiple ways. It provides a quick look at the status of each piece of content as it moves through the calendar (in process, under review, published). The following picture provides the fields that we use as a marketing organization and what we recommend using for your own calendar:
![]() Need a template pre-filled with these fields? Download our content marketing editorial calendar template today.
Need a template pre-filled with these fields? Download our content marketing editorial calendar template today.
3. Promotion
When it comes to content promotion, here is one question we were able to answer:
What should we promote in our newsletter?
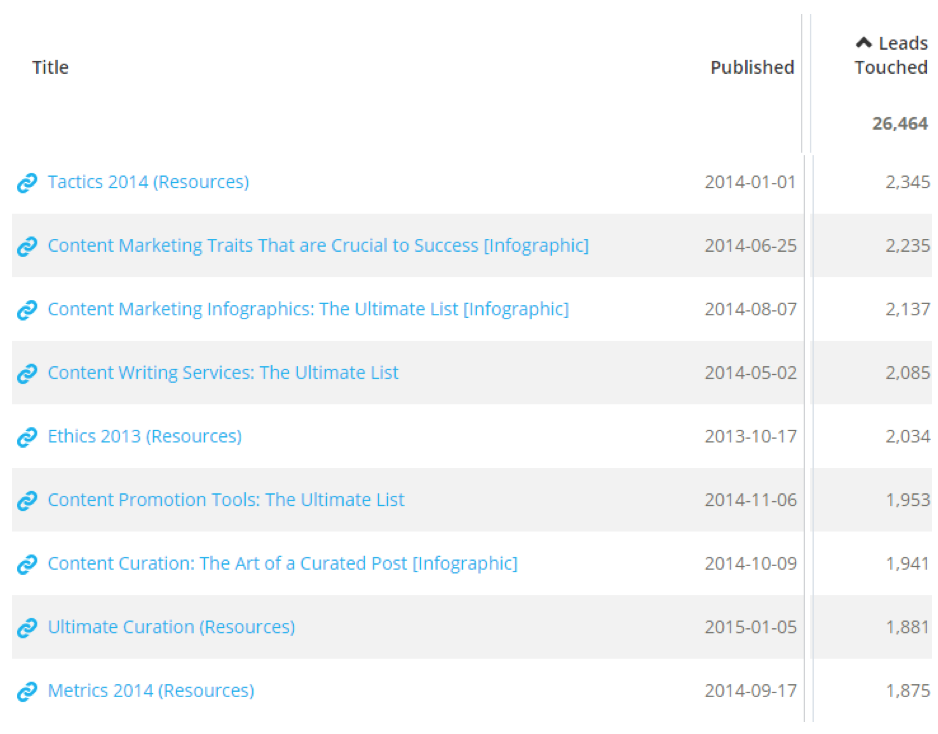
Since we decided to focus solely on fewer pieces of long-form content versus many pieces of short-form content, we needed to ensure there was a high enough quantity of content options in our weekly newsletter. We added more freshly curated content, and also included our most popular evergreen content. Again, we looked at the data to identify the best content for this effort.
We looked for content that was popular with our existing audience (i.e., through “leads touched”), as well as content that was doing well in terms of consumption such as page views. This is the content we would recycle and promote to our audience.
The Results
Creating a data-driven strategy is a work-in-process, and we still have many areas we would like to improve. For example, we’d like to incorporate more data sources and measure more content types (such as YouTube videos). However, since 2013 when we began measuring our content, we have seen the following results:
- 48 times more page views this year so far, versus the entire year of 2013 when we started measuring.
- 101 times more leads generated in 2016 to date, versus the entire year of 2013.
- 67 times more revenue generated via content in sales pipeline for 2016 to date, compared with 2013.
How to Get Started
Want to create similar results for your content marketing program? Here are a few ways to get started:
- Create an editorial calendar (these 12 must have fields are a good start).
- Start measuring basic analytics.
- Build a content measurement dashboard that combines your calendar and your stats together.
To learn more about each of these steps and to take a deeper dive into our content marketing journey, download a recording of my webinar, Data-Driven Content Marketing: How to Generate More Leads with Content.